Optimizing files for plotting
When it comes to plotting or any 2D CNC machining, there are common performance problems that can occur. Optimizing SVG files before plotting can drastically cut the time it takes to plot, and extend the life of motors / servos of your plotter.
Common problems in vector files that affect the plotting process (duration, speed, etc) are:
- Paths that are laid out in such manner that it makes the pen travel long distances unnecessarily
- Paths that are overlapped over other paths
- Paths that are too close to each other, yet require pen up / down movement
Let’s take a look at these problems closely and take a look at potential solutions!
Order and direction of paths
When you have SVG file with a large number of paths, the order in which paths occur in SVG file can make the pen travel larger distances than it should. You’d have to experiment with various order of paths inside SVG file on your machine to understand how the machine plots those paths. For example, some plotter software simply looks at the paths inside of SVG file and plots them in top to bottom order (order of the actual SVG nodes, not visual representation of the paths).
Simply changing the order in which the paths occur within the SVG file, can reduce the overall pen travel when plotting! Take a look at the diagram below:
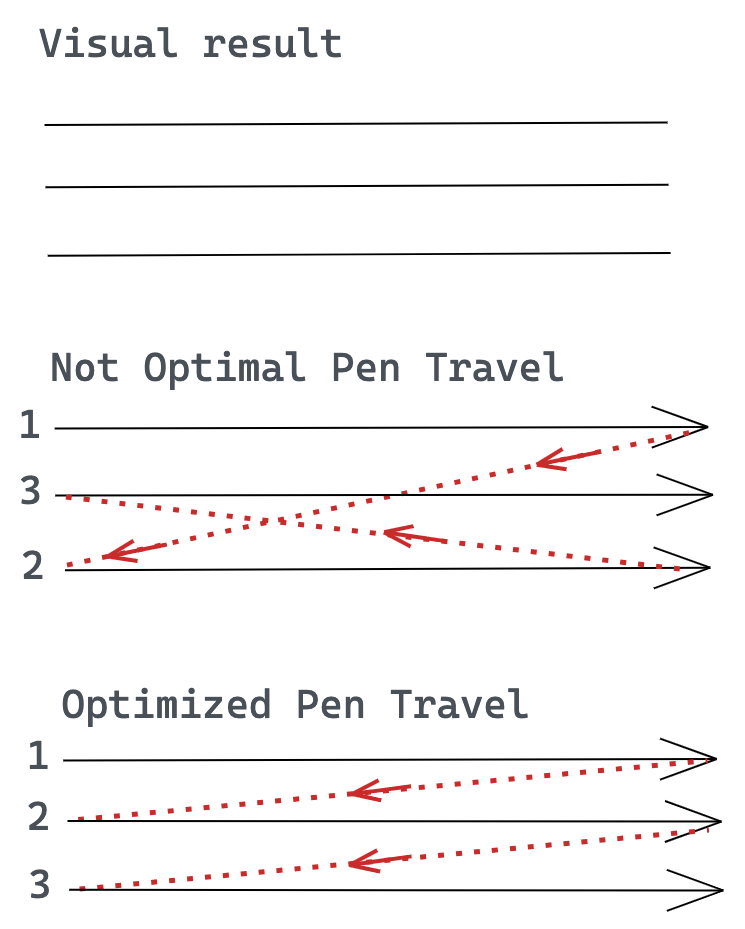
A different problem can increase pen travel distance. You might have paths that are drawn in the same direction (for example, from left to right). The direction of the paths can be reversed in some cases, making the pen travel a lot less. Take a look at the diagram below, when the pen travel is marked with red dotted line:

Merging overlapping paths
Not all software produces clean SVG output. In some cases, your SVG file might end up with paths that are exactly on top of other paths when they shouldn’t be. Simply removing those paths can ensure that your file plots quicker that it would otherwise! Take a look at the diagram below where there are two paths (marked with numbers 1 and 2). Removing path marked with number 2 would reduce overall plotting time:

Connecting paths that are too close
Finally, there might be paths whose ends are too close to other paths, and visually you wouldn’t notice the gap with a naked eye. Paths like that can be connected to each other to reduce the number of pen up / pen down movements. Take a look at the diagram below to see this illustrated:

All of these issues can be compounded inside of complex SVG files. Addressing these issues in a comprehensive manner can reduce the time it takes to go from SVG to a plot, and reduce unnecessary wear and tear on your plotter.
Thankfully there are now free tools to reduce these problems and to automatically address most of them! Let’s take a look at those below.
Solutions
The first free solution that you can use is to create your SVG files with aforementioned potential problems in mind. Of course that is not always possible, so you can use existing tools to do this work for you. There are at least three tools that have most of the mentioned optimizations available to you:
- VPype (https://vpype.readthedocs.io)
- saxi (https://github.com/nornagon/saxi)
- PlotterFiles SVG Optimizer (https://plotterfiles.com/tools/optimizer)
The linemerge, linesort and linesimplify CLI commands of VPype tool are excellent at optimizing your SVG files in ways that were illustrated above. You can try using some (or all) of those before you upload the SVGs to this website, or before you plot them.
Here is a sample VPype command to use aforementioned optimizations:
vpype read filename.svg linesimplify linemerge linesort write filename-optimized.svg
If you have your own way of optimizing files, please let me know on Twitter!